
Reports
Package: BASIC
1. General
The Reports module enables the evaluation of records from brainX. Data at a specific point in time or over a time period – e.g., a quarter – is summarized and analyzed so that data-based decisions can be made and business processes can be specifically adjusted. Reports allow important KPIs to be tracked and clear strategies to be defined.
Reports display data in tables by default. Additionally configurable charts and diagrams enable a quick visual overview.
The following report types are available:
- Tabular → Simple report with a header row and data rows, optionally with simple calculations.
- Calculations → Calculations based on groupings over up to three fields.
- Calculations with Details → Calculations with grouping over one field plus detail rows for individual records.
- Matrix → Calculations over up to three groupings, displayed in rows and columns with totals.
- Report Set → Collection of multiple reports and/or diagrams into a combined view.
Reports can be exported as PDF or CSV. The CSV export of reports runs in the background. After successful creation, a notification is displayed through which the file can be downloaded.
Via Scheduling, an automatic, time-controlled email delivery can additionally be configured.
1.1. Use Cases
Which channels deliver the most leads? Reports show at a glance where leads come from and which sources are particularly valuable.
Keep track of calls, tasks and meetings and measure the performance of individual employees.
Overview of open quotes including closing probability – for a reliable pipeline analysis.
Evaluate open tickets, processing times and communication volume to specifically improve support.
Runtime, generated leads and ROI of marketing campaigns at a glance.
The sales manager wants to receive an overview of revenue, open deals and closing rates every month. They create three reports (type Calculations) for the respective key figures and combine them in a Report Set. Via Scheduling, the report set is automatically sent as a PDF to the Sales group on the last working day of the month.
The support team leader wants to know how many tickets each team member has processed and completed in the last 30 days. They create a report of type Calculations with Details, grouped by the Responsible field, and set a permanent filter on the status completed and a date filter on the last 30 days. The result shows the number of tickets per employee as well as all detail rows.
Frequently used reports can be embedded directly on the Dashboard as a Dashboard Widget.
2. Report Types
2.1. Tabular
Simple report with a header row and the associated data rows. Optional: simple calculations on numeric fields.
The tabular report corresponds in its presentation to a classic spreadsheet: A header row names the selected columns, followed by the data rows below.
Optionally, simple calculations can be performed on currency, number and percentage fields: Sum, average, minimum and maximum value.
2.2. Calculations
Calculations based on groupings over up to three fields.
In the calculations report, up to three fields are selected by which the data is grouped. Different calculations can then be applied to all currency, number and percentage fields.
In addition to the standard calculations (sum, average, minimum and maximum value), counting of records is also available.
2.3. Calculations with Details
Calculations based on grouping of one field, combined with detail rows for individual records.
The Calculations with Details type combines the Calculations and Tabular report types. Only one column can be selected for grouping.
Unlike the tabular report, all fields of the respective module can be used as calculation columns – they do not need to be additionally present in the detail rows.
2.4. Matrix
Calculations over up to three groupings, displayed in rows and columns with totals per row and column.
The matrix report allows grouping by two or three fields. Unlike the Calculations report type, one of the groupings is displayed as a column instead of a row. Totals are formed for both rows and columns.
2.5. Report Set
Collection of multiple previously created reports and/or diagrams into a combined view.
A report set is not an independent report type in the strict sense: it combines multiple existing reports and enables a holistic view of individual business areas. Beyond pure comparisons, complex analyses can be built with extensive report sets.
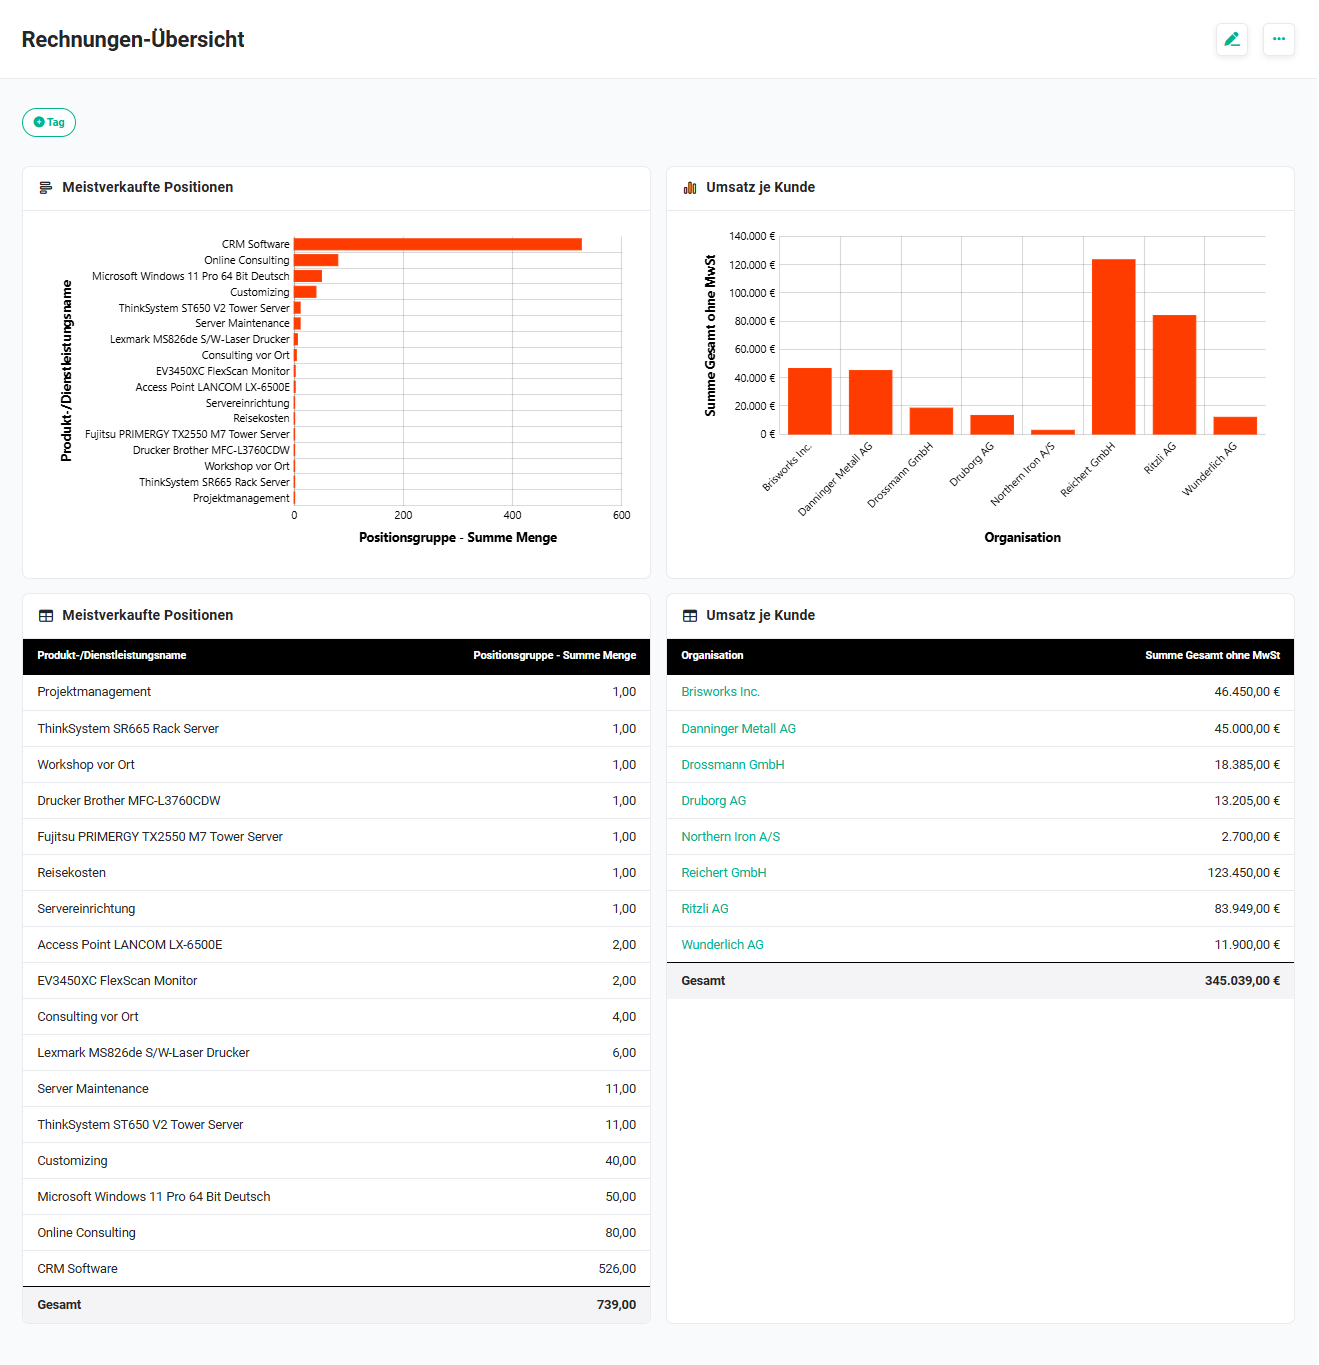 Example Report Set
In a report set, no fields are configured or calculations defined – only existing reports and diagrams are assembled. The creation process therefore differs from other report types. See section Create Report Set.
3. Permissions
3.1. General Permission Settings
The permission concept for the Reports module differs from standard modules. No settings can be made via Global Permissions.
Permissions are applied as follows:
- Create: Every user who is allowed to access the module can create reports and report sets. The Reports module can be deactivated per Profile.
- View: Administrators can view all reports. Other users see:
- public reports
- reports from hierarchically subordinate users
- reports explicitly shared with them
- Edit: Editing is permitted for:
- administrator permissions
- profile permission Edit All
- reports of hierarchically subordinate users
- own reports (owner)
- Delete: Reports can only be deleted by the owner or an administrator.
Depending on the profile permissions for individual fields and the permitted selection list values of the user role, it may happen that a report cannot be displayed. This occurs when columns for groupings or advanced filters may not be viewed or selection list values are not available for the respective role.
The export options in PDF and CSV format can also be authorized per Profile. This setting applies to both exports from the detail view and to the scheduled email delivery.
3.2. Sharing
For each report, the Sharing selection list can be individually configured to determine who can view the report:
- public – all users and groups can see the report.
- private – only the owner and users with administrator permissions can see the report.
- restricted – only selected users and/or groups can see the report via individual sharing.
3.2.1. Configure Individual Sharing
If the value "restricted" has been selected in the edit view, the "Configure Access" action icon (gear icon) appears. After clicking it, the "Sharing" popup opens.
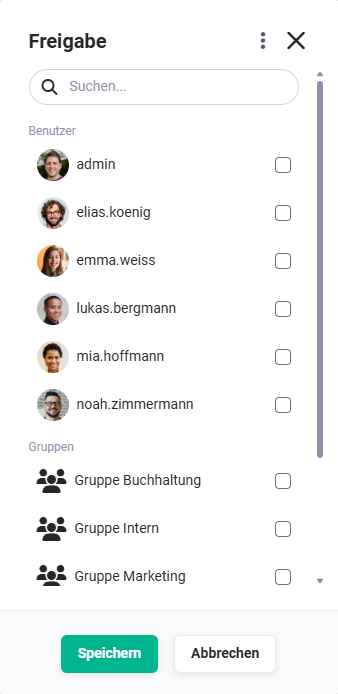 Sharing Popup
Users and/or groups who are allowed to view the report are selected via checkboxes.
4. List View
The list view of the Reports module has the usual functions of a list view in brainX. Further information can be found in the section Structure/Layout – List View.
4.1. Actions
In the list view – depending on the module – general actions are available. An overview and description of all general actions can be found in the section Actions (List View).
Additionally, the following module-specific actions are available:
| Action | Requirement | Functionality |
|---|---|---|
| Manage Folders | none | Create, rename and delete folders. For detailed information see section Manage Folders. |
4.1.1. Manage Folders
Reports can be stored in folders in an organized manner. After clicking the Actions button in the list view, a flyout menu opens with the action "Manage Folders".
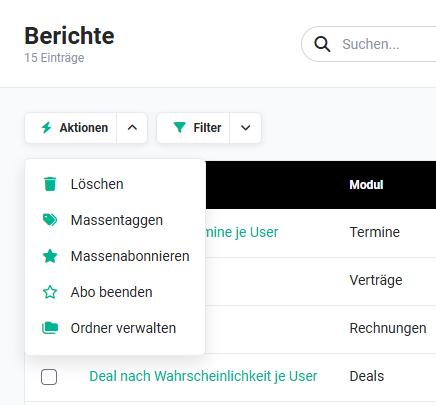 "Manage Folders" action in the flyout menu
After clicking "Manage Folders", the "Manage Directories" popup opens. All existing directories are listed therein; the number of reports contained is shown in brackets after the directory name.
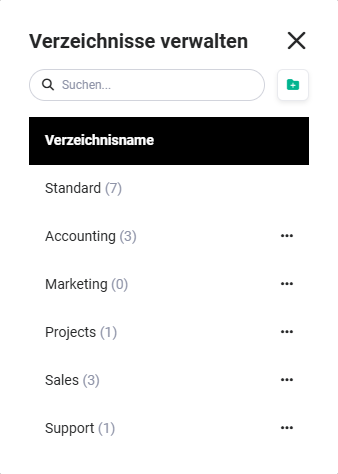 "Manage Directories" popup
The "Default" directory cannot be edited or deleted. Folders with identical names cannot be created more than once.
The following actions are available in the popup:
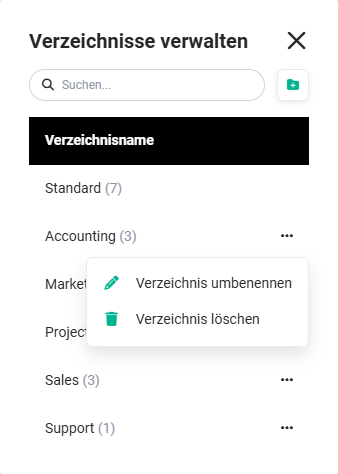 "Manage Directories" popup – Rename and Delete
4.1.2. Create Directory
After clicking the "Create Directory" button (folder icon), the search field switches to an input field for the directory name. After entering the name, the directory is created by pressing the Enter key and displayed in the list.
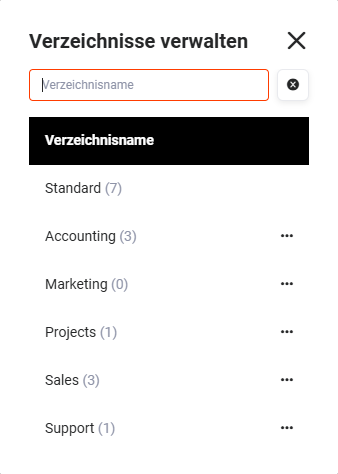 "Manage Directories" popup – Create Directory
4.1.3. Rename Directory
Behind each directory name is the "Three Dots" icon. After clicking, a flyout menu opens with the options "Rename Directory" and "Delete Directory".
After choosing "Rename Directory", the name becomes editable. The change is saved using the "green checkmark" icon.
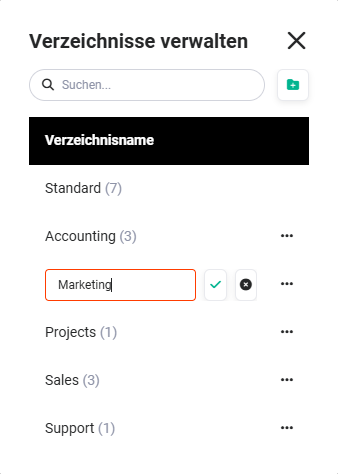 "Manage Directories" popup – Rename Directory
4.1.4. Delete Directory
After choosing "Delete Directory" from the flyout menu ("Three Dots" icon), a different popup is displayed depending on whether the directory still contains reports:
- Directory without reports: A confirmation popup asks whether the directory should really be deleted. The action is completed via "Confirm".
- Directory with reports: A popup requests selection of a target directory to which the existing reports will be moved. The action is also completed via "Confirm".
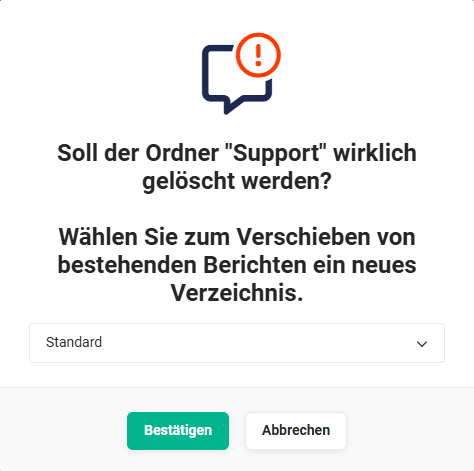 "Delete Directory" popup
5. Detail View
In the default state, the detail view of a record has standard fields, which are described below.
5.1. Report Details Block – Fields
| Field | Description |
|---|---|
| Report Name * | Name of the report. |
| Module * | The module whose records are evaluated. Almost all modules in brainX are available for selection, including Users (not a standalone module, but usable for reports about brainX users). |
| Folder * | Directory in which the report is stored |
| Owner * | User who owns the report When creating a new report, the owner is automatically set to the currently logged-in user. However, this can also be changed. |
| Show Revision-Safe Data | When activated, revision-safe (archived, immutable) data states are included in the report |
| Record Limit | Maximum number of records evaluated in the report. No entry means no limit. |
| Grouping Limit | Maximum number of groups displayed in grouped reports. No entry means no limit. |
| Sharing * |
|
| Scheduling | Activates the automatic, time-controlled email delivery of the report – see Section 6.1.2 Scheduling |
*Required field
5.2. Filter Block
In the "Filter" block, the permanently configured filters of the report are displayed. In the detail view, additional temporary filters can be set without having to open and edit the report.
 Filter block – without configured filter
 Filter block – with filter for the "Status" field
Using the "Add Filter" button, additional individual filters are added; using "Add Group", logically related filter groups can be created. After clicking Apply, the temporary filters take effect; "Reset" removes them again.
The functioning of filters is described in detail in Section 6.4 Filter.
5.3. Diagram and Data Block
In the "Diagram and Data" block, diagrams and the actual report data are displayed – if configured.
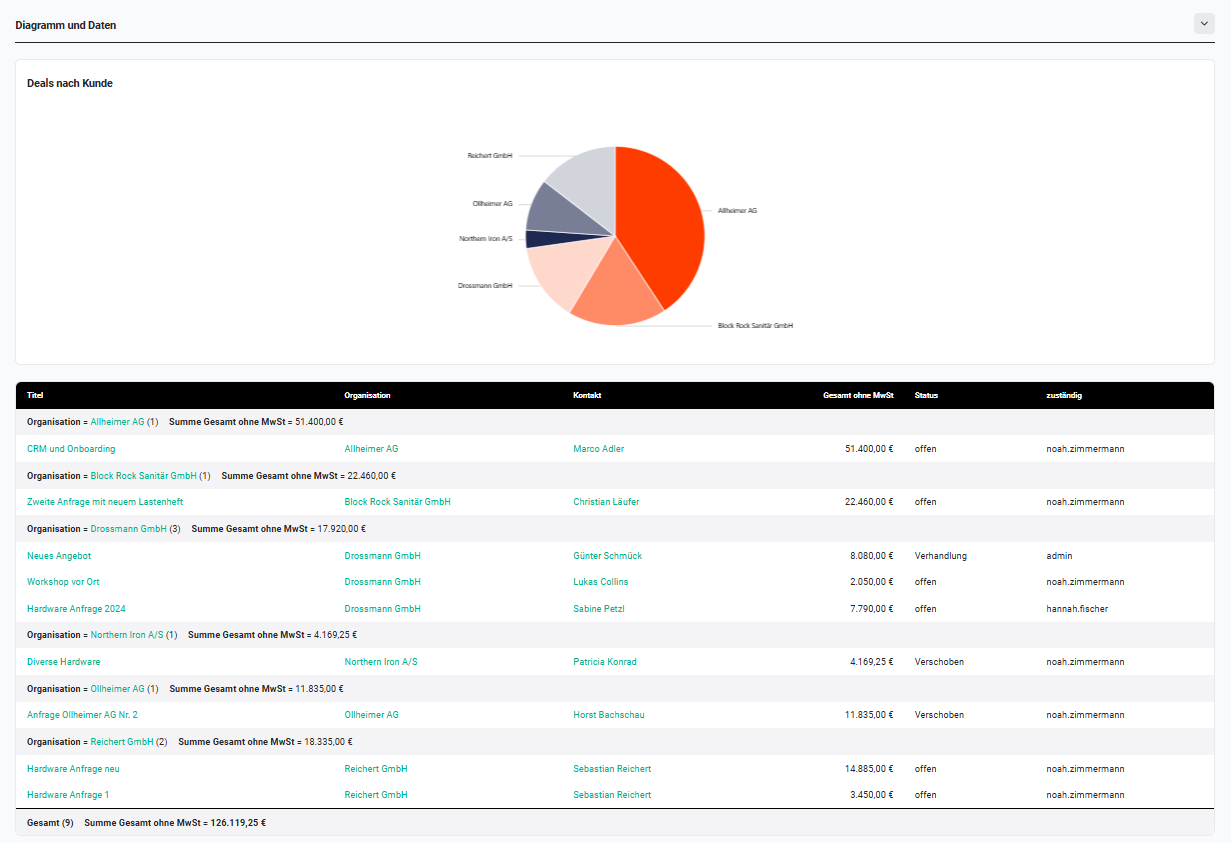 Sample report "Deals by Customer" (type "Calculations with Details") with pie chart
6. Create Report
After clicking the "Create Report" button in the list view, the "Select Report Type" popup opens.
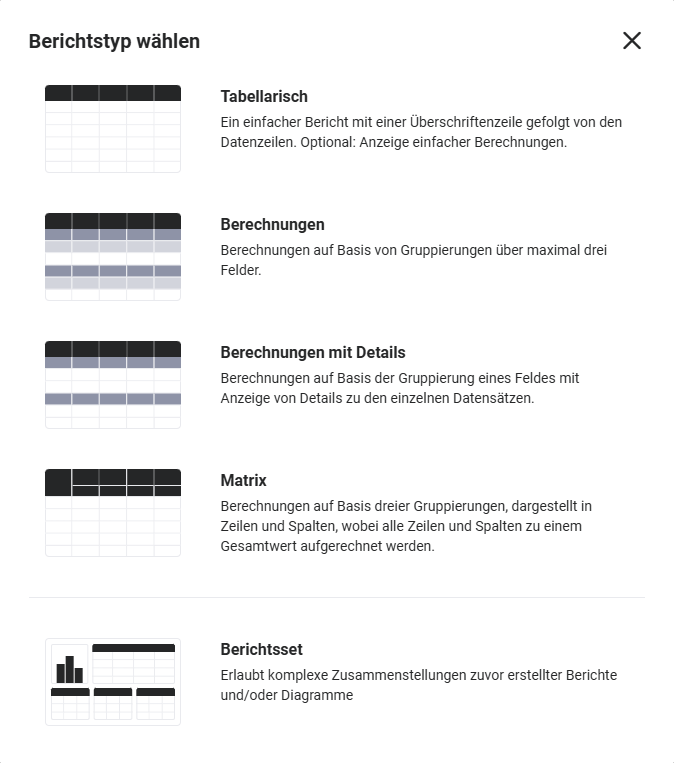 "Select Report Type" popup
After clicking a report type, the creation view opens. The creation is divided into up to five steps:
The Report Set type follows a different creation process, as no new data reports are created – instead, existing reports are assembled. See section Create Report Set.
6.1. Report Details
In the "Report Details" step, the basic information of the report is defined: name, main module, folder and description. Almost all modules in brainX are available as the main module.
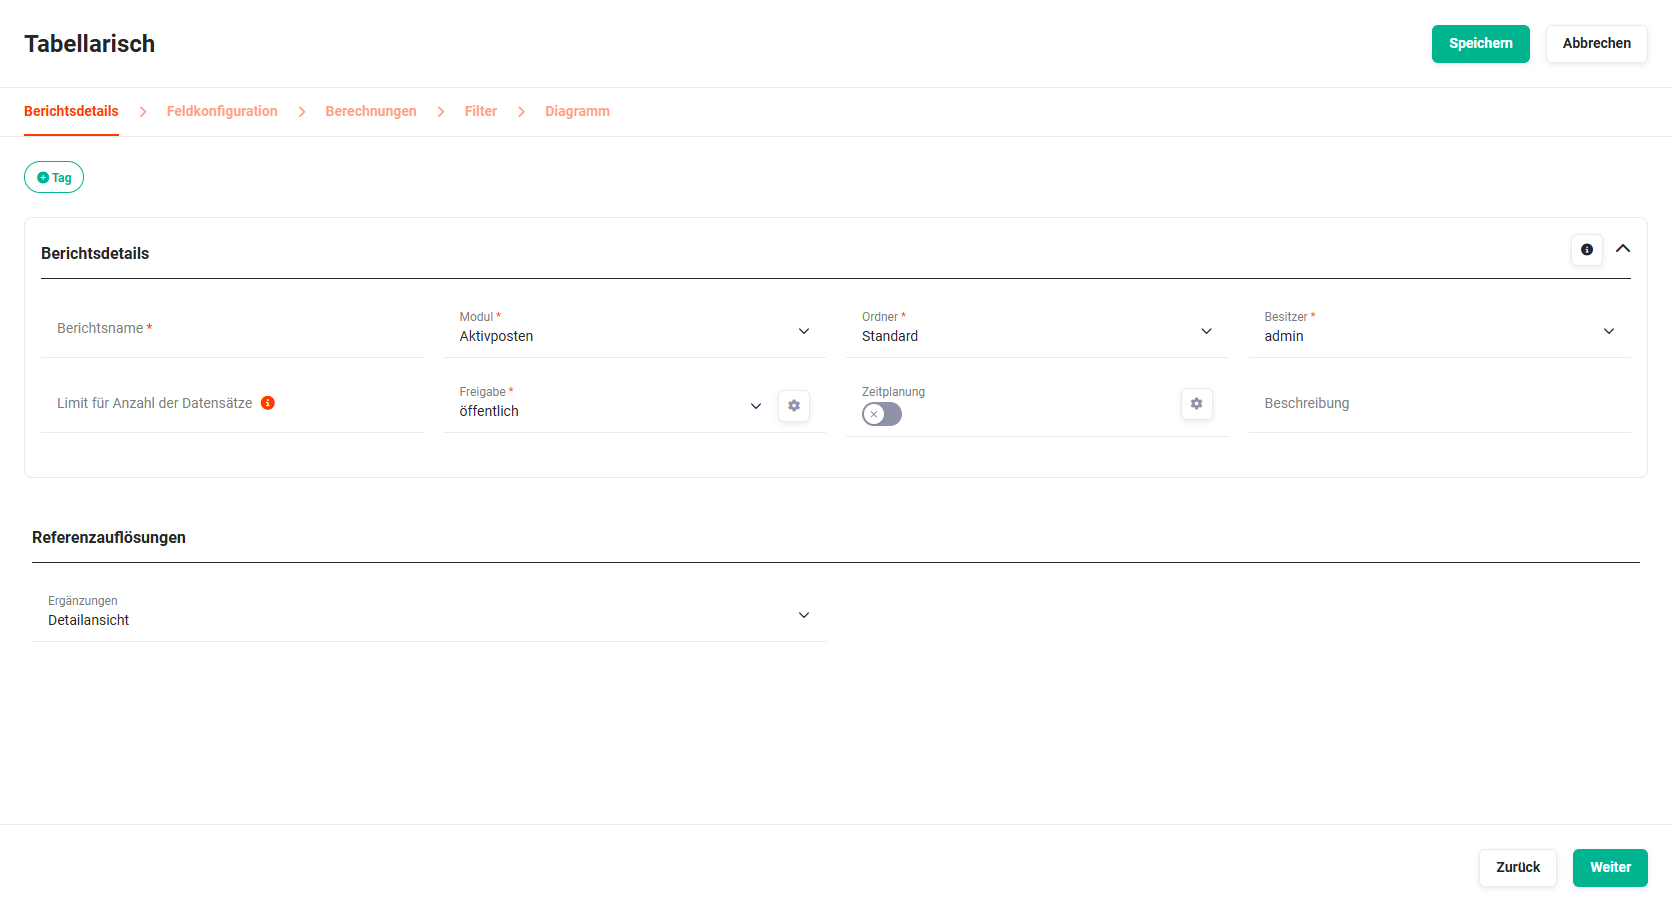 Creation view – "Report Details" step
Once a module has been selected in the Report Details step and the next step has been accessed, the module can no longer be changed. If the wrong module was selected, there are two options:
- Refresh the browser page – this resets the module selection; all previously entered information (name, folder, description) will be lost.
- Use the "Cancel" button and restart the creation process.
In the "Module" selection list, "Users" is also available for selection. Users is not a standalone accessible module, but enables the creation of reports about brainX users.
A complete description of all fields can be found in section Report Details Block – Fields.
6.1.1. Scheduling
The scheduling feature allows the report to be automatically sent by email to selected users and/or groups at configured times.
Example 1: The head of customer service receives a weekly statistic on created customer tickets.
Example 2: The Sales group automatically receives the current revenue figures at the end of the month.
When the "Scheduling" toggle is activated, the "Delivery Schedule" popup opens.
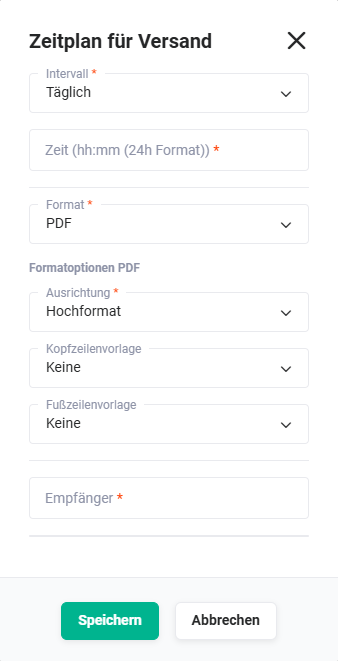 "Delivery Schedule" popup
General
| Field | Description |
|---|---|
| Interval * |
|
| Time |
|
| Format | Format of the sent file: PDF, CSV or Both |
| Recipients | Selection of Users and/or Groups who receive the report by email |
*Required field
PDF Format Options
| Field | Description |
|---|---|
| Orientation | Page orientation of the PDF file: Portrait or Landscape |
| Header Template | Selection of a header template (optional) |
| Footer Template | Selection of a footer template (optional) |
CSV Format
| Field | Description |
|---|---|
| Format |
|
| Delimiter |
|
6.2. Field Configuration
In the "Field Configuration" step, the fields of the selected module that appear in the report are defined. The available fields are displayed on the left in a list and can be transferred to the report's column selection via Drag & Drop or using the corresponding buttons. The order of columns can also be adjusted via Drag & Drop.
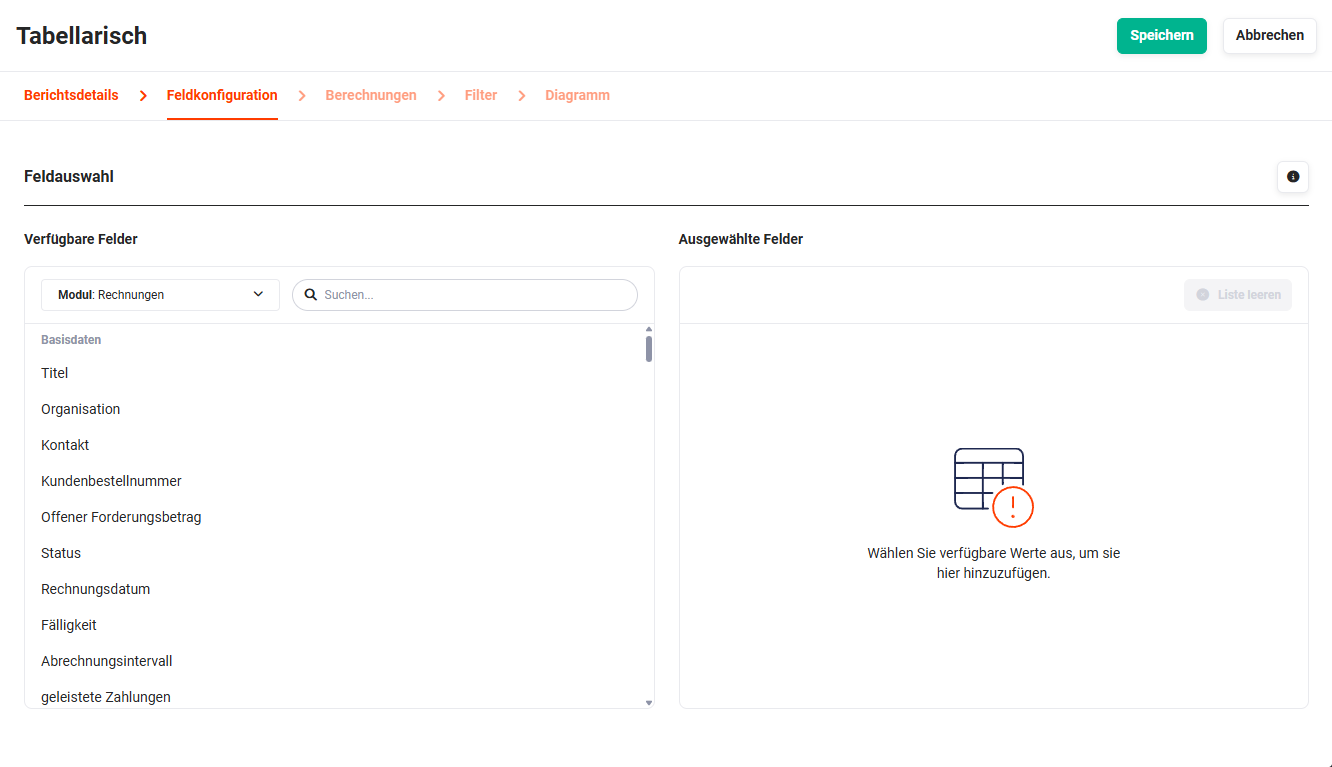 Example creation of report type Tabular – Field Configuration step
Different fields are selectable depending on the report type:
- Tabular: All fields of the module are available as columns.
- Calculations / Matrix: Grouping fields and calculation fields are configured separately.
- Calculations with Details: In addition to the grouping field, detail columns and calculation columns are selected separately.
When grouping by date fields (report types Calculations, Calculations with Details and Matrix), the following year-independent grouping options are available in addition to year-based intervals:
- Month, year-independent → groups all records by calendar month, regardless of year
- Quarter, year-independent → groups all records by calendar quarter, regardless of year
This is useful, for example, for birthday lists, seasonal analyses or analyses of contracts renewed in a specific month or quarter – across multiple years.
When grouping by date fields with time, the time is ignored – grouping is exclusively by date.
6.3. Calculations
In the "Calculations" step, the aggregation to be applied to the numeric fields (currency, number, percentage) selected in the previous step is defined.
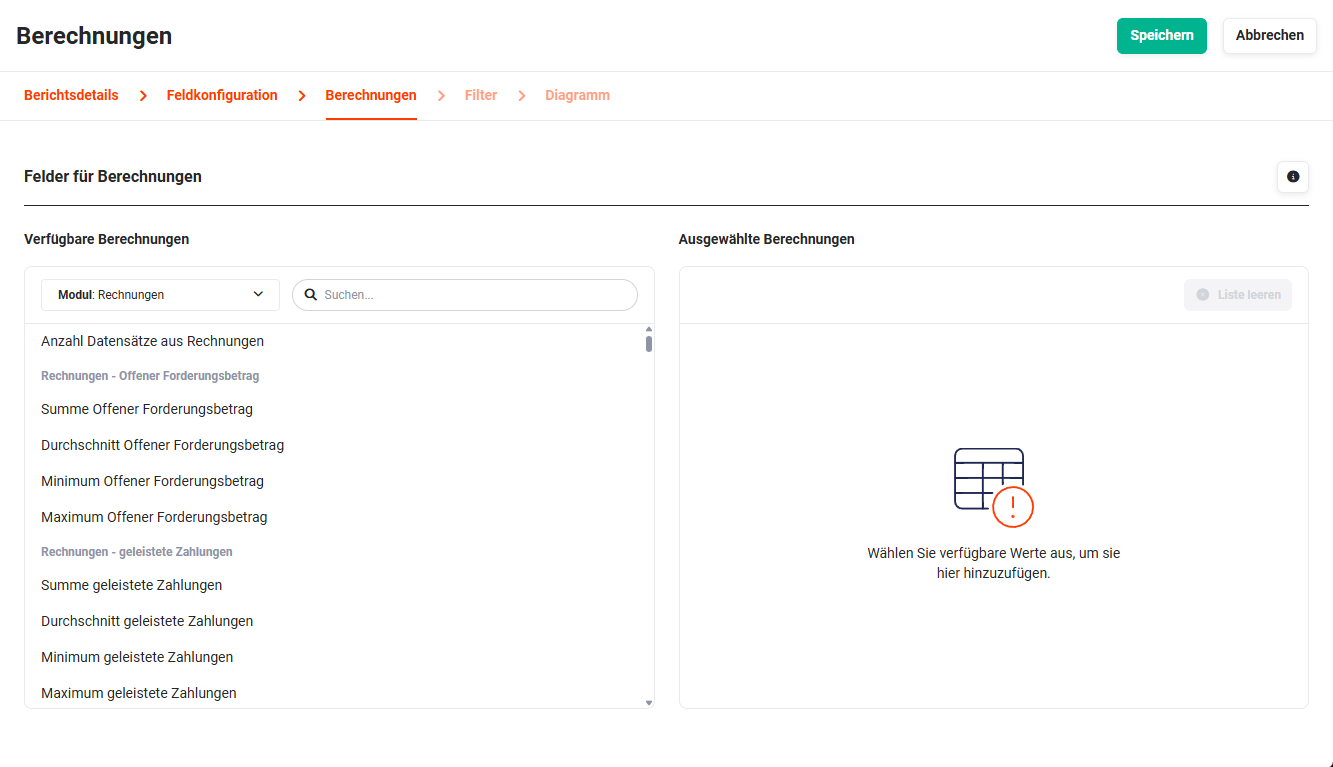 Example creation of report type Calculations – Calculations step
Available calculation types:
- Sum – Total sum of all values in the group.
- Average – Mean of all values in the group.
- Minimum – Smallest value in the group.
- Maximum – Largest value in the group.
- Count – Number of records in the group.
6.4. Filter
In the "Filter" step, the permanent filter rules of the report are configured. Filters restrict the evaluated records before the calculations are performed.
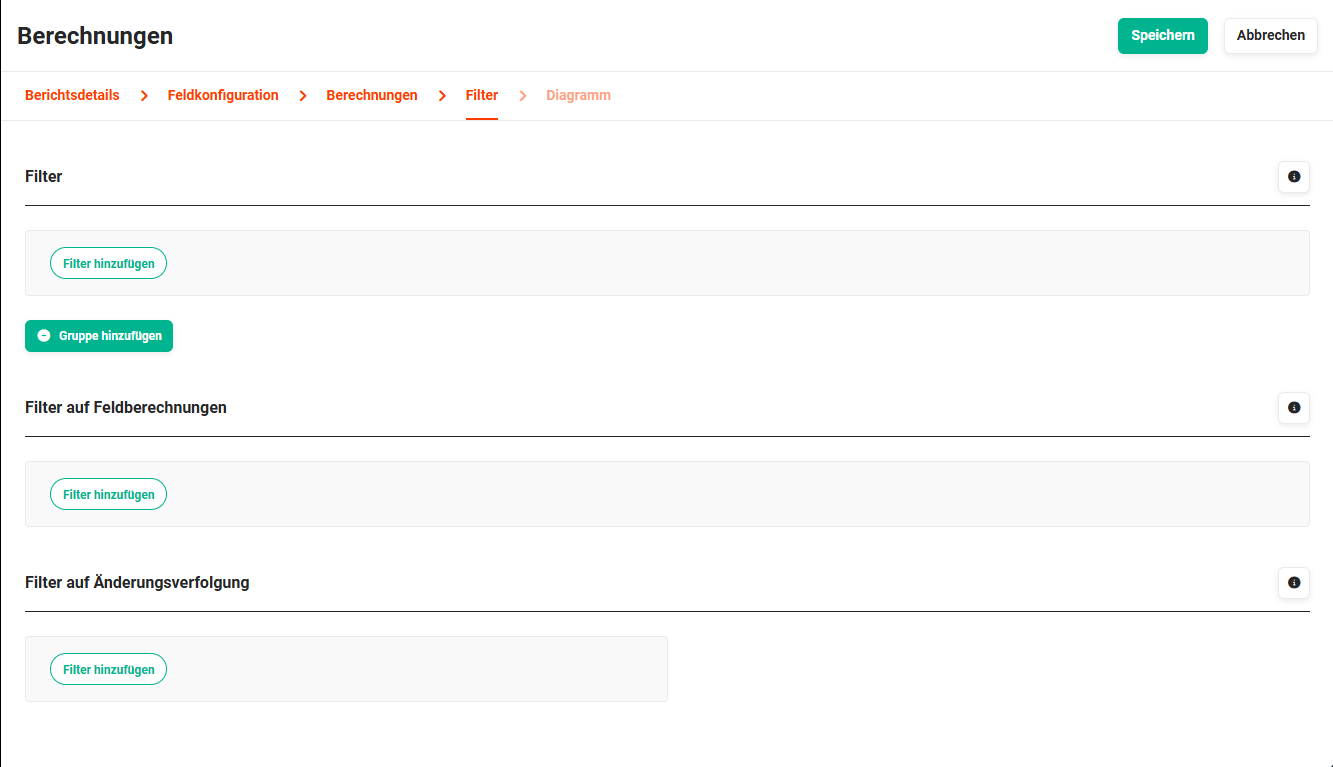 Example creation of report type Calculations – Filter step
Individual filters are added via "Add Filter". Multiple filters within a group are linked with AND by default. Via Add Group, alternative conditions (OR link between groups) can be defined.
For each filter, the desired field, the operator (e.g., equals, contains, greater than) and the comparison value are specified. For relational fields, the linked records are available for selection.
For date fields, two additional filter options are available:
- In Month → filters by a specific calendar month, year-independent (e.g., all records from January, regardless of year)
- Custom (year-independent) → enables filtering by year-independent months and quarters
When filtering on changes to line items in the Filter step (change tracking), only the line items matching the filter criterion are displayed in the report – not all line items of the respective record. Multiple line item filters can be combined with AND and OR.
Temporary filters in the detail view supplement the permanent filters without overwriting them. They are discarded after leaving the view. See section Filter Block.
6.5. Diagram
In the "Diagram" step, a diagram can optionally be configured for the report. The diagram is displayed in the detail view in the "Diagram and Data" block above the table and responds dynamically to temporary filters.
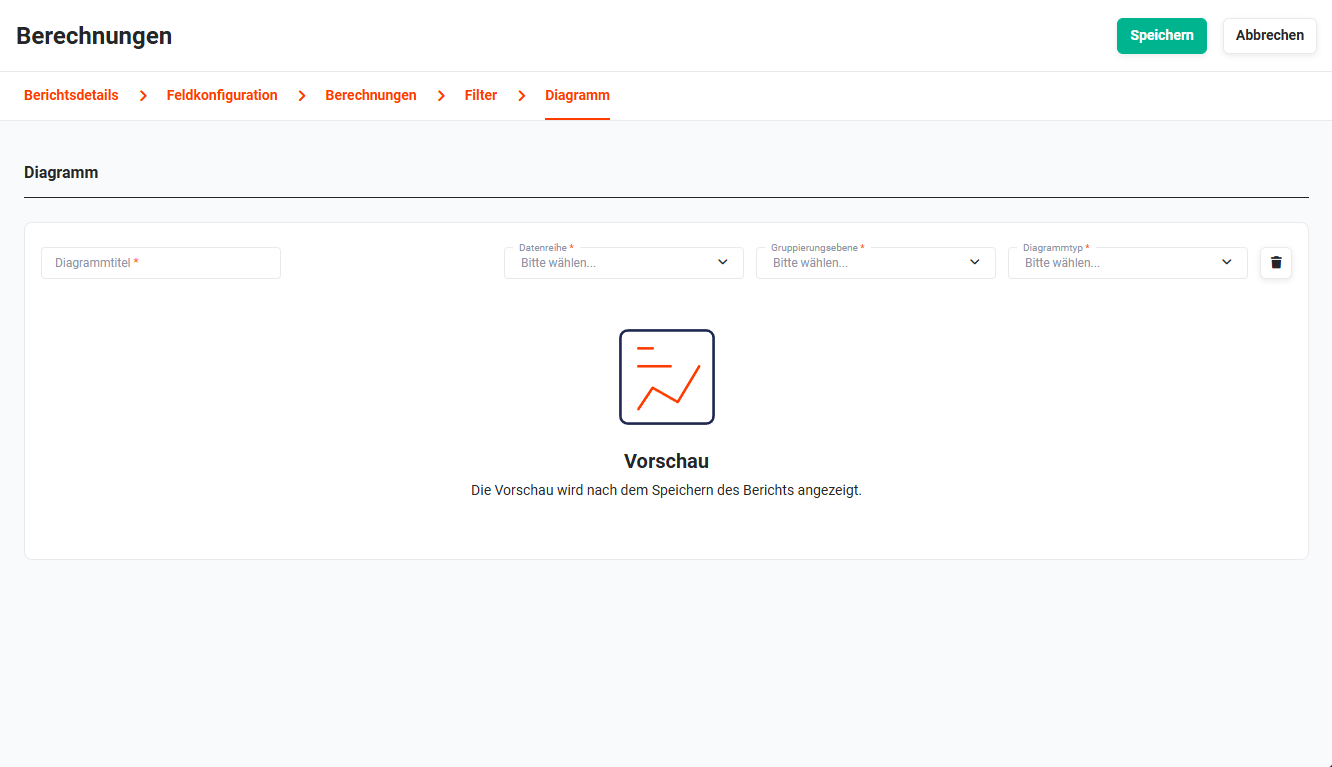 Example creation of report type Calculations – Diagram step
In this step, diagram type, field selection, calculation type and grouping are configured in a combined view. When creating a diagram from a list view or a report, the step for module and view selection is automatically skipped, as this selection is already fixed.
If Count is selected as the calculation type, the field selection is omitted – it is not required in this case. Up to two groupings can be configured.
Available diagram types:
- Bar chart (horizontal/vertical)
- Line chart
- Pie chart
- Donut chart
When grouping by a date field, an additional interval for grouping can be set (e.g., day, week, month, quarter, year). A year-spanning grouping option is also available, allowing records to be grouped by calendar month or quarter regardless of year.
7. Create Report Set
A report set combines multiple existing reports and/or diagrams into a combined view. Unlike other report types, no fields are configured or calculations defined – only existing reports and diagrams are assembled.
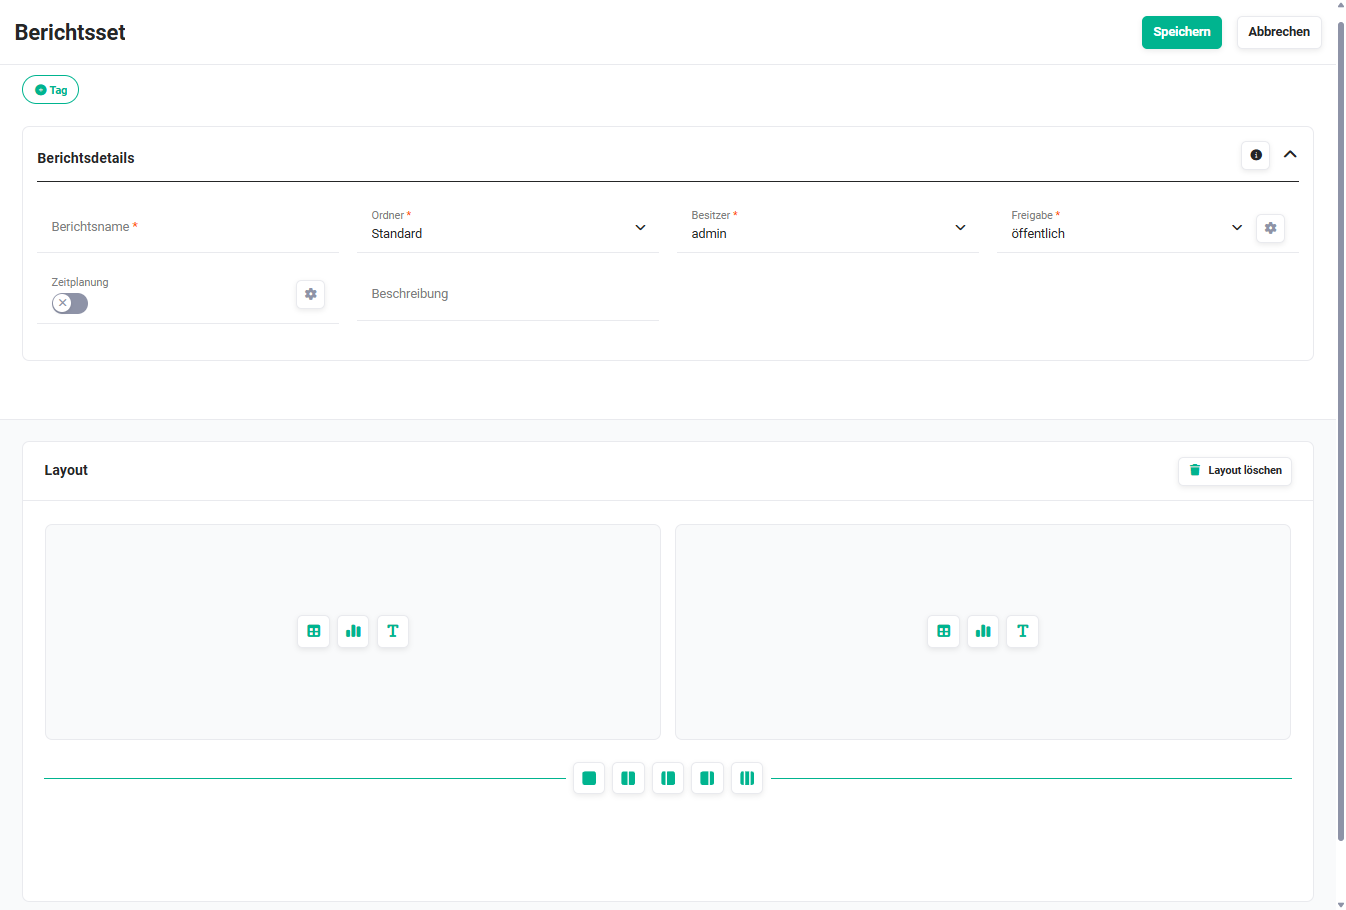 Example creation of report type Report Set
Report sets can be used to build complete company dashboards – e.g., a monthly sales report that combines revenue, pipeline and activities in a single view.
The creation view of a report set is divided into two blocks:
- Report Details → corresponds to the Report Details block of a report
- Layout → Definition of the layout of the report set
7.1. Choose Layout
Five options are available for the layout of a report set:
- single-column
- two-column
- two-column, right larger
- two-column, left larger
- three-column
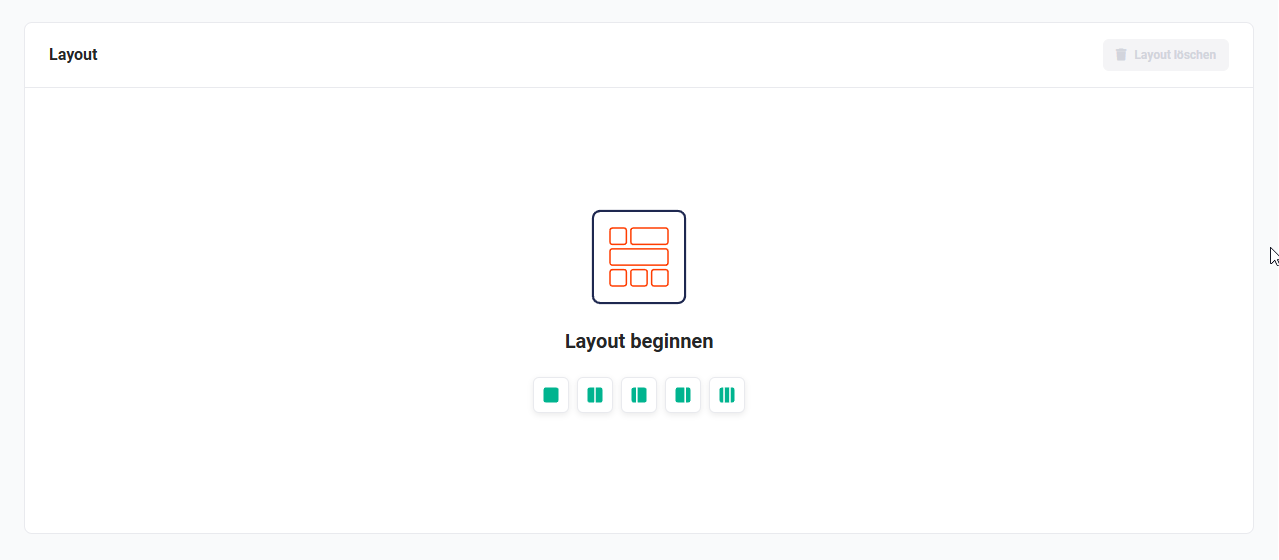 Report Set – start layout
After selecting a layout, the creation view looks as follows:
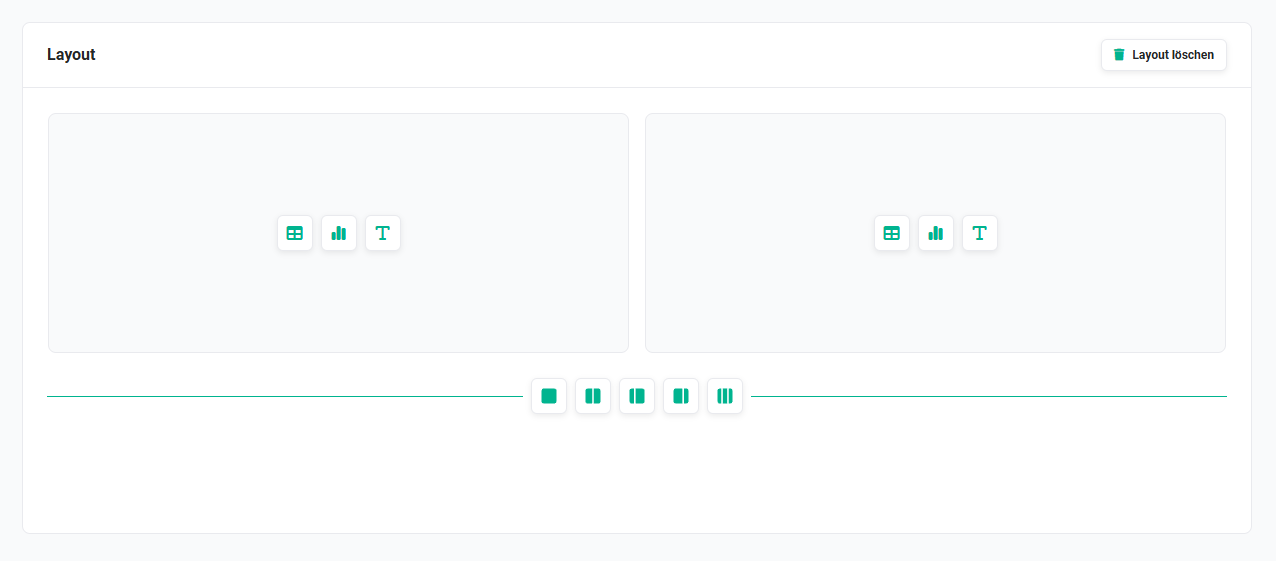 Report Set – two-column layout
Each row contains – depending on the selected layout – a corresponding number of cells. Within a cell, reports and diagrams can be selected and texts entered.
For each additional row, a separate layout can be set using the selection buttons:
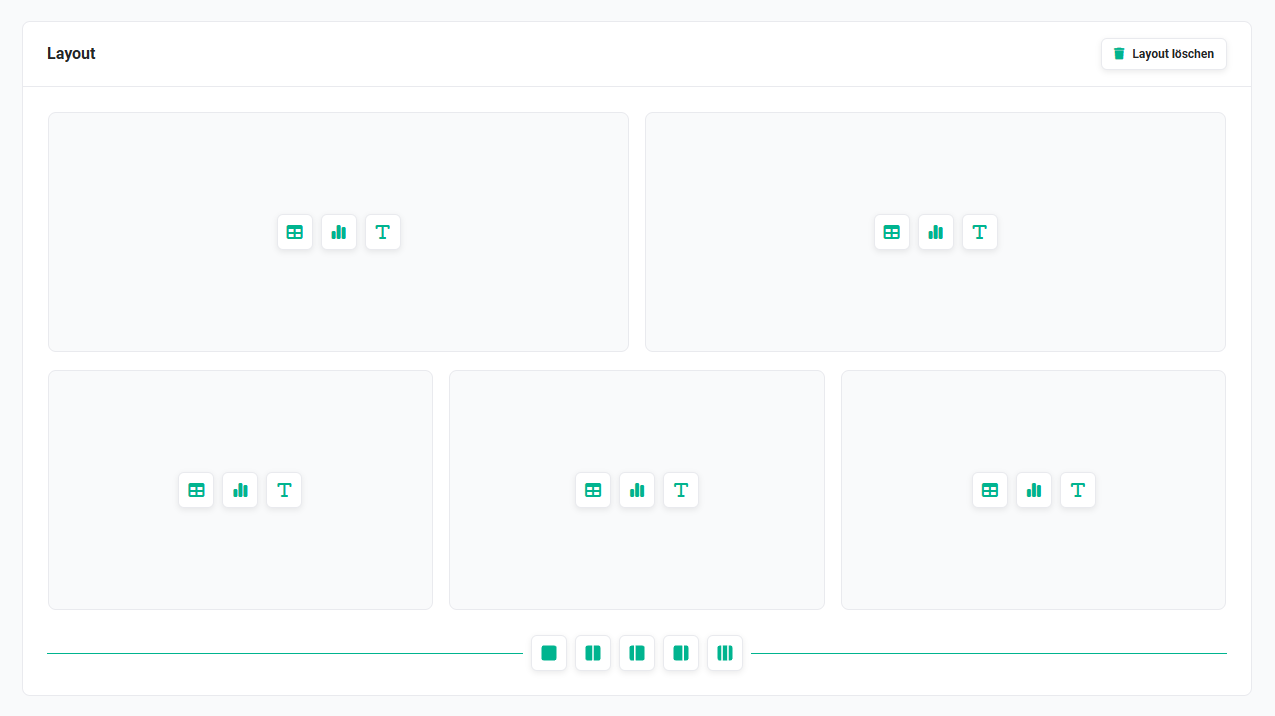 Report Set – Row 1 two-column layout, Row 2 three-column layout
7.2. Edit Layout
The layout can be adjusted at any time during creation.
On mouseover of a cell, the following action icon is displayed:
- Move Cell (icon "Four-Direction Arrow") → in a multi-column layout, the cell can be moved horizontally.
On mouseover of a row, the following action icons are displayed:
- Delete (icon "Recycle Bin") → the row is deleted.
- Change Row Layout (icon "Layout") → the layout of the row is changed.
- Move Row (icon "Four-Direction Arrow") → the row is moved vertically.
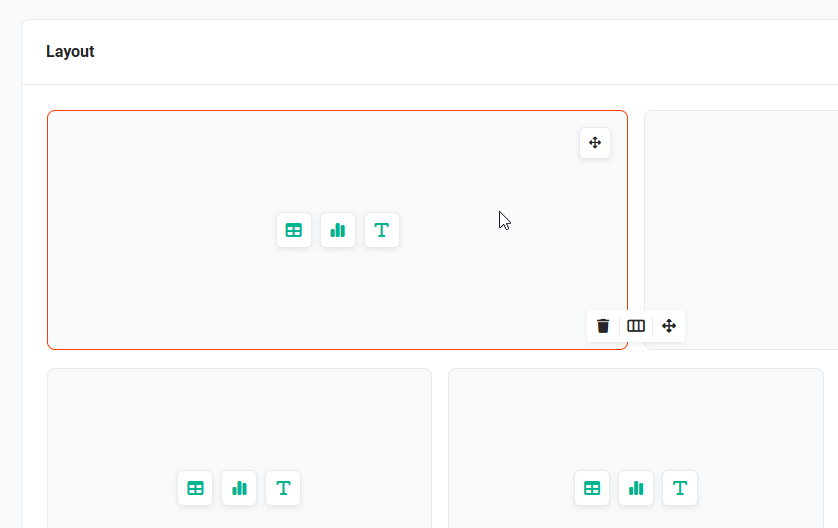 Edit Layout – action icons
The entire layout can be removed using the "Delete Layout" button to start fresh with a new layout.
7.3. Select Report/Diagram/Text
Within a cell, the following options are available for configuring the content:
- Select Report (icon "Report") → opens a popup to select a report
- Select Diagram (icon "Diagram") → opens a popup to select a diagram
- Enter Text (icon "T") → opens a popup for text input
7.3.1. Select Report
After clicking the "Select Report" button, the "Reports" popup opens.
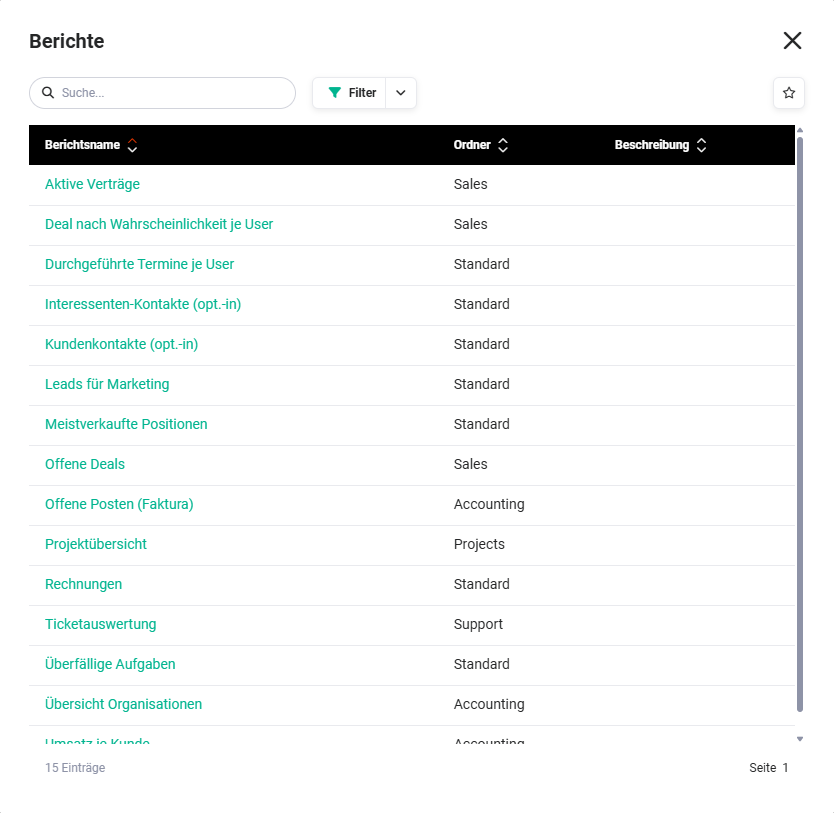 Reports popup
After clicking a report name, another popup opens in which it is selected whether the report data or the associated diagram should be used.
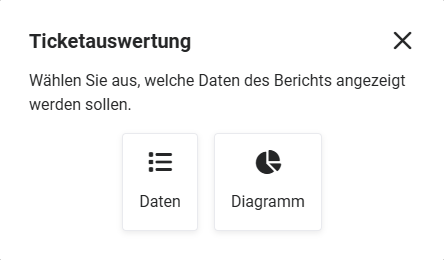 Data/Diagram selection
By clicking the respective button, either the data or the diagram is transferred to the cell.
7.3.2. Select Diagram
After clicking the "Select Diagram" button, the "Diagrams" popup opens:
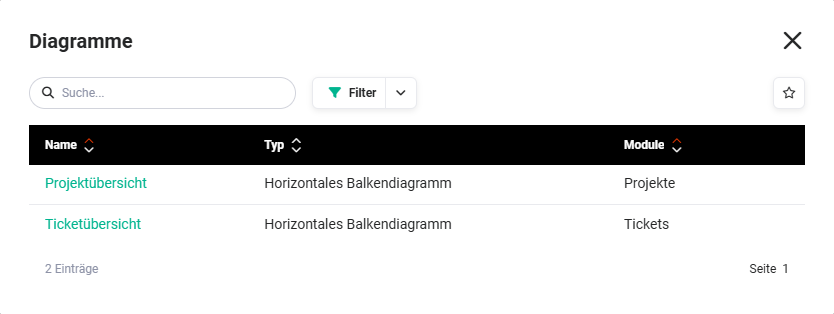 Diagrams popup
Selection is made by clicking the diagram name.
After selection, the "Clear Cell" and "Move Cell" action icons as well as the "Preview" action icon are displayed in the cell. After clicking "Preview", a popup with a preview of the diagram opens.
7.3.3. Enter Text
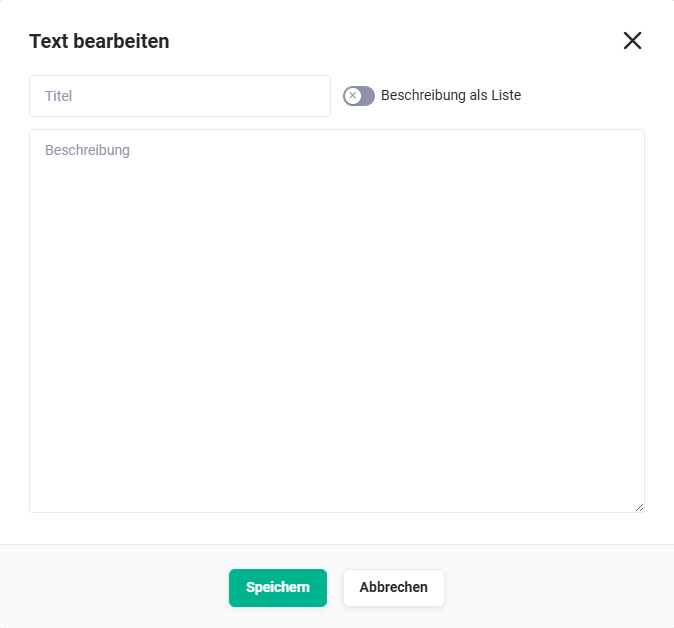
In a report set, each cell can contain descriptive text. After clicking the "Enter Text" button, the "Edit Text" popup opens.
 "Edit Text" popup
- Title → Cell heading
- Description as List (toggle) → when the toggle is active, each new line in the "Description" field is displayed with a bullet point.
- Description → Text area for descriptions, information or details about the report
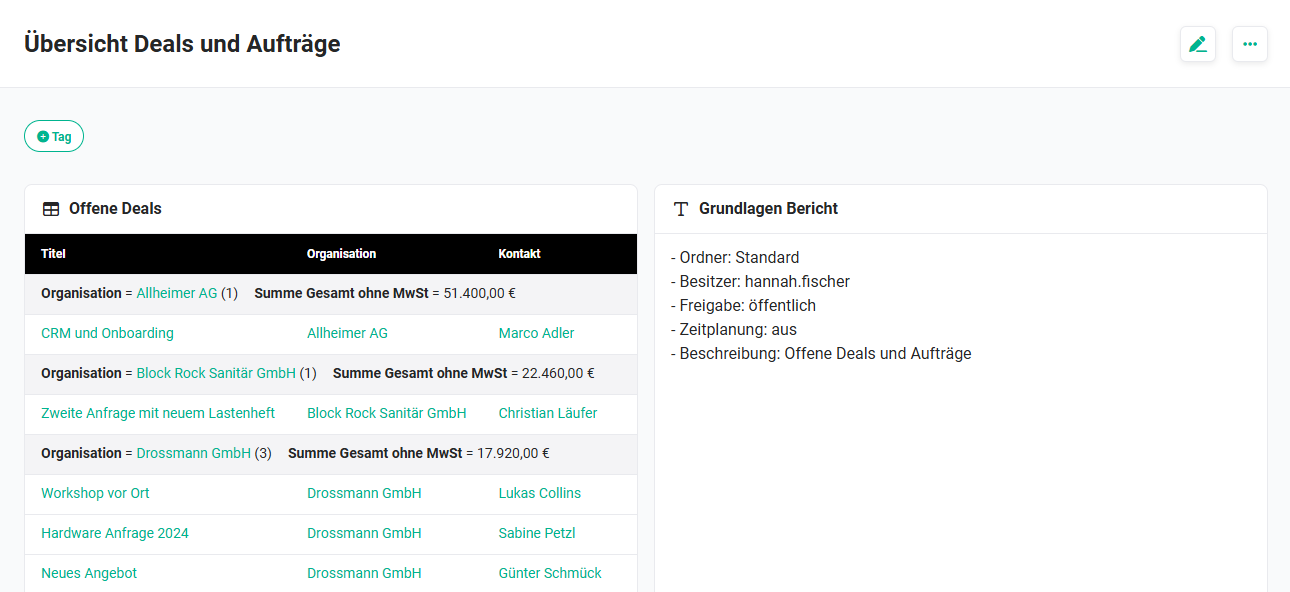 Example cell with text
8. Practical Examples
1 – Monthly Sales Reporting as Report Set with Automatic Delivery
The sales manager of a company wants to receive a complete overview of revenue, open deals and closing rates on the last working day of each month – without having to manually access the report.
First, three separate reports of type Calculations are created: one for monthly revenue (grouped by month), one for open deals (filtered by status Inquiry Received, Deal Sent and Negotiation), and one for the closing rate (ratio of won to lost deals). A diagram is optionally configured for each report.
Then a Report Set is created that combines all three reports in a two-column layout. Via Scheduling, the automatic delivery is configured as monthly, last working day, as PDF to the Sales group. From that point on, the sales team receives the report automatically without manual effort.
2 – Support Evaluation by Employee with Detail Rows
The support team leader wants to know how many tickets each team member has processed and completed in the last 30 days – including the individual ticket details.
They create a report of type Calculations with Details on the Tickets module. Responsible is selected as the grouping field. In the Filter step, two permanent filters are set: Status equals completed and a date filter on the creation date of the last 30 days. Count is selected as the calculation column to show the ticket count per employee.
The result shows the total number of completed tickets per employee as well as all associated detail rows. The report is shared with restricted sharing only for the team leader and the support group.
3 – Campaign Performance with Matrix Report and Dashboard Widget
The marketing team wants to evaluate the performance of running campaigns: How many leads has each campaign generated, broken down by lead source and month?
A report of type Matrix is created on the Leads module. Campaign is selected as the row grouping, Month (Creation Date) as the column grouping. The Count calculation column provides the number of leads per combination. A permanent filter on Status not equal to lost excludes already qualified and discarded leads from the count.
The finished report is then directly embedded as a dashboard widget on the start page, so the marketing team can always see campaign performance at a glance.
9. Frequently Asked Questions
Can I change the module of a report afterwards?
No. Once a module has been selected in the creation process and the next step has been accessed, the module can no longer be changed. In this case, the creation must be restarted using the Cancel button or by refreshing the browser page. All previously entered information will be lost.
What is the difference between permanent and temporary filters?
Permanent filters are configured during the creation or editing of a report in the Filter step and always apply when the report is accessed. Temporary filters, on the other hand, can be set additionally in the detail view of the report without changing the report – they supplement the permanent filters and are discarded after leaving the view. Temporary filters also affect PDF and CSV exports as well as diagrams.
Can a report be automatically sent by email?
Yes. Via Scheduling in the report details, an automatic, time-controlled email delivery can be configured. The report can be sent daily, weekly, biweekly, monthly or annually to selected users and/or groups as PDF, CSV or both. The first delivery occurs directly after saving, as soon as the background task Report Scheduling is executed next.
Who can view or edit a report?
Administrators can view and edit all reports. Other users see public reports, reports from hierarchically subordinate users, and reports explicitly shared with them. Users can edit their own reports and reports from hierarchically subordinate users – provided no deviating profile permissions are set. A report can only be deleted by the owner or an administrator.
Can I organize reports in folders?
Yes. Via the Manage Folders action in the list view, directories can be created, renamed and deleted. Each report is assigned to a folder upon creation. The default directory Default cannot be edited or deleted. When deleting a folder with existing reports, these are moved to another directory.
Can I display a report directly on the start page?
Yes. Frequently used reports can be embedded as dashboard widgets on the start page. Detailed information can be found in the section Dashboard Widgets.